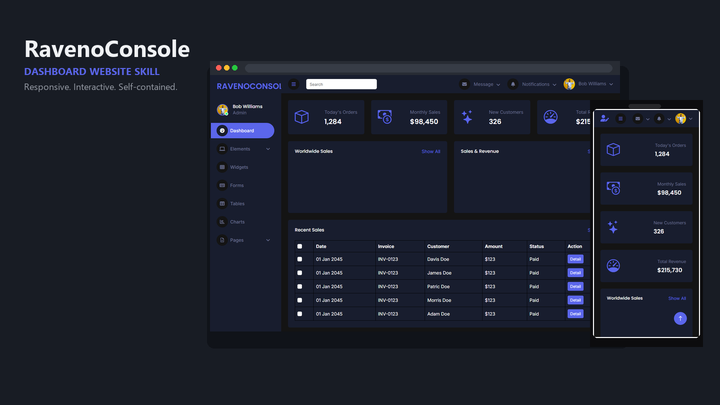
Web Design Raveno Console
By Sam Rivera
Web Design Raveno Console draft pack.
OtherClaude · Cursor · Codex
$4.99100 downloads
Clarity at data density
Dashboards fail quietly: every metric gets a card, every state looks the same, and the one number that matters is buried. These packs give your agent patterns for data-dense interfaces — tables, charts, filters, and status states — with a hierarchy decided in advance.
Last updated 2026-11-07
From the live Skillux catalog
4 matching skills. Check each listing for its contents and license.
By Sam Rivera
Web Design Raveno Console draft pack.
By Sam Rivera
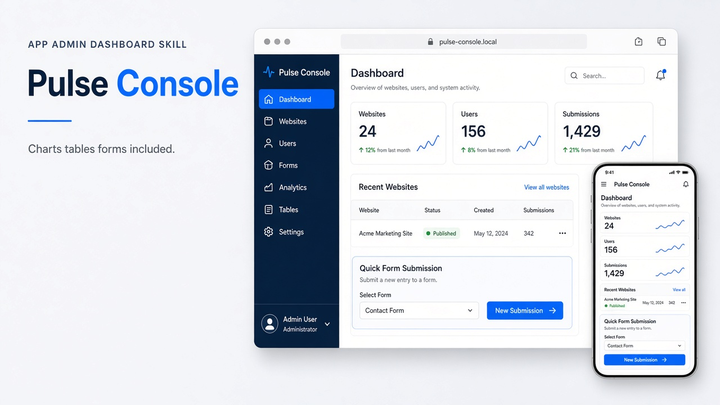
Web Design Pulse Console draft pack.
By Sam Rivera
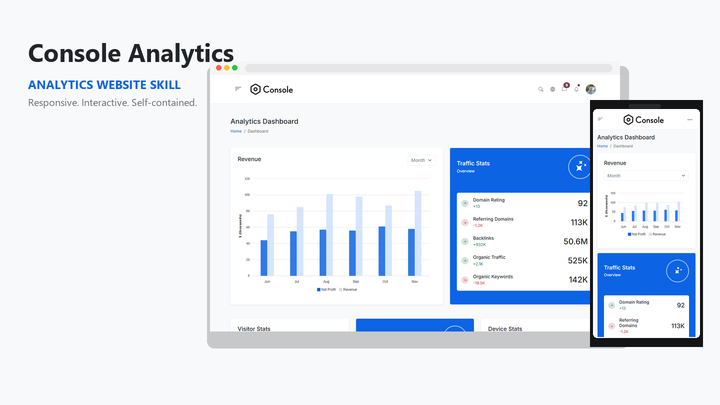
Web Design Console Analytics draft pack.
By Jordan Blake
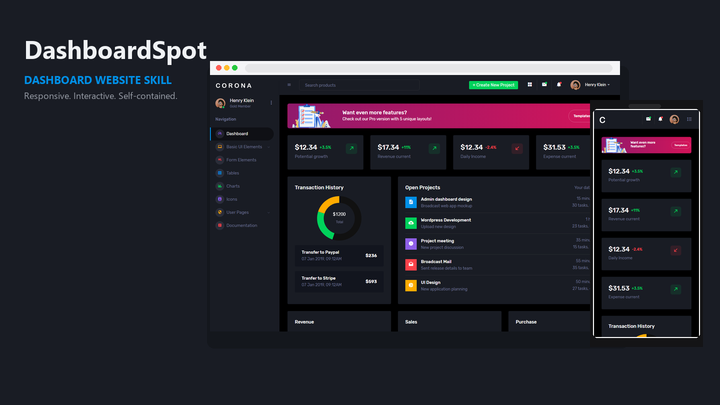
Web Design Onyx Console draft pack.
Put the skill to work
Name the decision the dashboard supports and the metric that drives it. A good pack gives that metric visual priority and demotes supporting data, instead of dealing every number the same card.
Consoles spend much of their life loading, empty, stale, or failed. The Skillux guide on UI loading, empty, and error states is a useful companion when you brief these regions explicitly.
Skillux publishes a service dashboard repair case study that walks through diagnosing and fixing a real admin interface. It shows the review loop these packs are meant to support: find the hierarchy problem, then correct it.
Ask for sorting, filtering, and pagination behavior in the brief, and test with long labels and many rows. Dashboard templates often look clean with five rows and break with five hundred.
Compare the console and admin packs below. Look for the table, chart, and navigation patterns closest to your product, and confirm your agent and stack on the listing.
Install the pack using the guide, then describe who watches this dashboard, what they act on, and which metric matters most. Include the states each region must handle.
Generate with long names, edge-case values, and a full table. Check that priority, status colors, and row actions survive real data before extending the console.
It focuses on data-dense interfaces: metric hierarchy, tables, charts, filters, and status communication. A general pack can style a dashboard, but a console-oriented pack makes the density decisions explicit.
Yes, the same patterns apply: navigation, tables with row actions, forms, and status states. Check each listing's preview to see whether it leans toward analytics, operations, or content administration.
Rank the metrics in your brief and say which one drives the user's decision. Ask the agent to explain its hierarchy before it builds, and review whether the rendered page matches that ranking.